
Shopping cart

close
Tel : 94870 36000, 94860 36000, 94890 36000

Top 10 Solar Power Solutions for Businesses in 2026

For businesses planning in 2026, solar is no longer a distant sustainability ambition. It is a practical energy decision shaped by daytime demand, roof space, tariffs, and resilience needs. The IEA’s Renewables 2024 report says global renewable capacity additions reached nearly 510 GW in 2023, with solar PV contributing around three-quarters. That momentum matters. But global growth does not guarantee a good project at every site.

Costs have shifted, too. IRENA’s Renewable Power Generation Costs in 2023 report found that utility-scale solar electricity was 12% cheaper than in 2022. Its average cost was 56% below the weighted average cost of fossil-fuel power. These figures offer context, not a promise of savings for one company. Local rates, interconnection delays, financing, and equipment choices can change the outcome. Small details matter.

IEA Executive Director Fatih Birol described the broader shift this way: “Solar is the new king of electricity markets around the world.” For business buyers, the useful question is what kind of system fits their operations. Rooftop arrays, solar carports, battery storage, power-purchase agreements, and energy-management software each solve different problems. Some sites may need less equipment than expected; others may need grid upgrades first. This guide to the Top 10 Solar Power Solutions for Businesses in 2026 compares those options through a practical lens. It also treats “Power Solutions Solar” as more than a technology label: the right choice depends on measurable needs, credible performance data, and a realistic plan for maintenance.
Top 10 Solar Power Solutions for Businesses in 2026

Business Solar Fundamentals: Global PV Capacity Reached 1,419 GW in 2023

Global photovoltaic capacity reached 1,419 GW in 2023, a measure of how much solar generation equipment had been installed worldwide. That figure signals a mature, rapidly expanding technology—not a guarantee that every business can generate power cheaply. Installed capacity is not the same as electricity delivered: clouds, seasonal daylight, equipment performance, and grid constraints all affect actual output.

For a business, the useful question is what solar can do at a specific site. A warehouse roof may offer broad, unobstructed space, while a shaded roof or limited grid connection can change the economics. Compare expected generation with hourly electricity use, not just annual bills. A midday-heavy operation may use more solar directly; an evening-focused site may need storage or another supply arrangement. Local tariffs and connection rules matter, too.

A remarkable scale. Yet global totals can hide local friction. Before investing, review roof condition, structural capacity, interval meter data, and realistic production estimates with qualified professionals. Ask how assumptions were calculated, and test them against a cloudy month or lower-than-expected output. Estimates are not promises. It is easy to make the spreadsheet look certain; real sites are less tidy.

The Top 10 Business Solar Solutions: Rooftop, Carport, and Ground-Mount PV

Business solar projects work best when the system matches the site, not just the electricity bill. Rooftop photovoltaic panels use existing space and can reduce daytime grid purchases. Before planning, check roof age, structural capacity, shading, and access for maintenance. A roof that needs replacement soon may make installation timing awkward. That detail is easy to overlook.

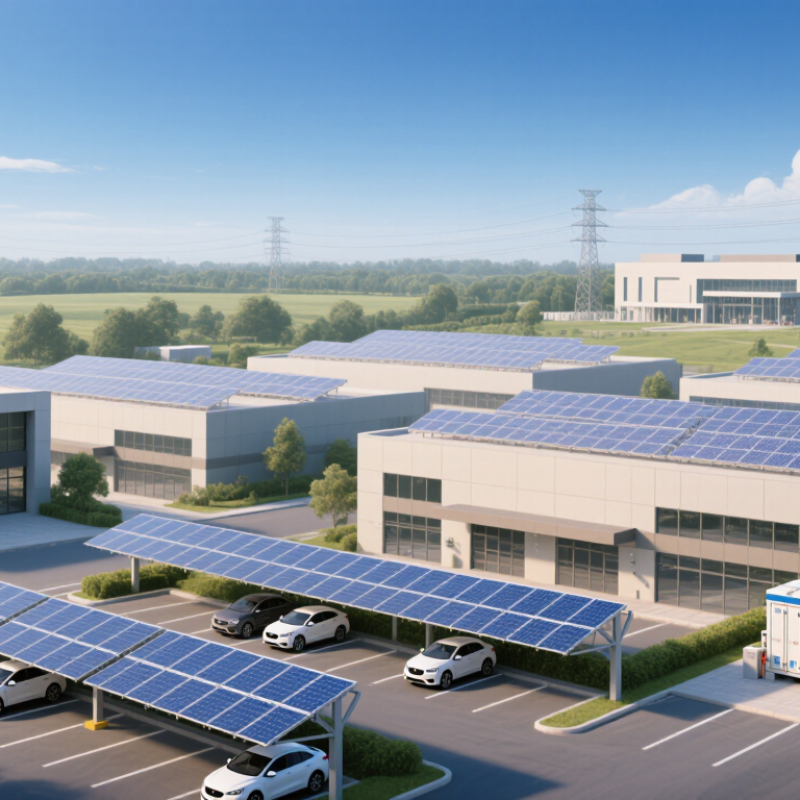
Solar carports turn parking areas into energy-producing structures while providing shade for vehicles. They can suit offices, warehouses, and retail sites with large lots. Their supports, drainage, lighting, and vehicle clearances need careful design.

Ground-mount systems offer more freedom to set panel angle and orientation, but require suitable open land, secure access, and manageable cable routes. They may compete with future expansion or other land uses.

Tips: Compare rooftop, carport, and ground-mount options using the same assumptions for energy use, installation costs, and maintenance. Ask for a site assessment that includes interval electricity data, roof or soil conditions, and expected operational changes. Check how the system will perform during cloudy periods, and clarify who monitors faults. Small details matter. A carport may look ideal on paper, yet create inconvenient traffic flow; a rooftop may be simpler, but only if the structure is ready. Be willing to revise the plan.

Beyond Panels: Storage, Microgrids, Building-Integrated PV, and Solar Thermal

For businesses in 2026, solar planning is about more than panel output. Battery storage can shift midday surplus into evening hours or support selected loads during outages. Size it using interval-level demand data and clear priorities, not just annual electricity use. A cold-storage site may value steady backup more than a quick payback. Batteries also bring replacement, cooling, safety, and control-system costs. They are not magic.

A microgrid links solar, storage, controls, and chosen building loads. If designed to operate independently, it can keep essential equipment running when the wider grid fails. That capability takes careful testing and coordination; it should not be assumed from having batteries on site. Building-integrated photovoltaics offer another route, placing solar cells in façades, canopies, or roof elements. They can suit a new build, but appearance, energy yield, maintenance access, and weatherproofing must all work together. The roof still has to keep water out.

Solar thermal collectors make heat directly, often for hot water or process needs. Hotels, food producers, and laundries may have useful demand, but their schedules matter. Compare seasonal heat use with collector output and keep a practical backup plan. Annual totals can mislead: weekend shutdowns or a quiet summer may change the economics. That detail is easy to miss. A good design may be less elegant than expected, and that is worth questioning before construction.

Top 10 Solar Power Solutions for Businesses in 2026

Typical commercial PV module efficiency ranges by technology

Ranges are indicative product-level figures; actual efficiency varies by product and specification. BIPV ranges are especially broad because building-integrated products must also meet architectural and building-envelope requirements. Storage, microgrids, and solar thermal complement PV but are not directly comparable by electrical module efficiency.

Comparing Solutions by Site, Load, Financing, and 2023 Industry Benchmarks

Comparing ten commercial solar solutions starts with the site, not the equipment list. A flat warehouse roof may fit many panels, yet roof age, shade, fire lanes, and structural limits can reduce usable space. A parking canopy costs more to build, but can shelter cars and support daytime charging. Ground-mounted arrays need land, drainage checks, and a workable grid connection. Details matter.

Load changes the ranking. A business with steady daytime demand may use solar power directly, while a site with evening peaks may value batteries or demand controls. Review at least a year of utility bills, then compare hourly use with expected generation. Then model storage. Oversizing a system can leave more power exported than expected; that is an easy mistake when relying on annual totals alone.

Financing also affects the real comparison. Cash ownership, loans, leases, and power-purchase agreements shift upfront cost, maintenance duties, and savings differently. Use 2023 industry benchmarks for installed cost per watt, annual output, and levelized energy cost as reference points, not as current bids. Costs vary with project size, labor, location, and grid upgrades. The comparison remains imperfect without site-specific engineering and tariff review.

Top 10 Solar Power Solutions for Businesses in 2026 — Comparing Solutions by Site, Load, Financing, and 2023 Industry Benchmarks
Solution Best-Fit Site Typical Load Fit Common Financing Best For Key Considerations 2023 Benchmark Context
Rooftop solar — direct ownership Large, structurally suitable roofs with limited shading Steady daytime electricity use that can absorb a substantial share of solar generation Cash purchase or commercial loan Businesses seeking ownership of the equipment and long-term bill savings Requires capital and due diligence on roof condition, interconnection, and local export rules. Part of the U.S. solar market, which added 32.4 GWdc in 2023. This national figure does not isolate commercial rooftop installations.
Rooftop solar — third-party ownership Suitable commercial roofs where the business prefers not to own equipment Predictable daytime loads with enough roof area for a useful system On-site power purchase agreement (PPA) or equipment lease Reducing upfront expenditure and assigning some equipment responsibilities to a provider Review contract term, electricity-price escalators, roof access, maintenance duties, and end-of-term options. The 2023 U.S. market benchmark describes installations across ownership models; it is not a measure of PPA or lease pricing.
Solar carport or parking canopy Parking lots with suitable spacing, access, and electrical connection points Daytime loads, especially where parking is occupied during business hours Direct purchase, loan, lease, or on-site PPA Generating power while providing covered parking Structural supports and site work can add complexity; account for drainage, lighting, and vehicle circulation. The 32.4 GWdc U.S. addition in 2023 is a market-wide figure, not a carport-specific benchmark.
Ground-mounted on-site solar Available, unshaded land near the facility and electrical infrastructure Large or growing loads that exceed practical rooftop capacity Direct ownership, loan, lease, or on-site PPA Sites needing more array area or easier equipment access than a roof allows Check land-use approvals, setbacks, grading, drainage, security, and interconnection capacity. A 2023 U.S. utility-scale solar LCOE benchmark was approximately $24–$96/MWh; utility-scale costs are not directly comparable with behind-the-meter project costs or retail rates.
Solar plus battery — demand-charge management Sites with suitable solar space and electricity tariffs that include demand charges Loads with brief, high peaks that can be reduced using stored energy Purchase, loan, lease, or a storage-service agreement Potentially reducing billed peak demand and shifting solar energy to later hours Value depends on tariff rules, battery size, dispatch controls, degradation, and operating limits. The 2023 solar capacity benchmark does not measure battery savings; battery economics depend on local tariffs and operating conditions.
Solar plus battery — backup power Facilities with critical equipment and a feasible islanding design Loads that need backup for selected circuits rather than the entire site Direct purchase, loan, lease, or resilience-focused financing Supporting critical operations during some grid outages Solar panels alone generally shut down during a grid outage; backup requires compatible controls, storage, and electrical design. The 2023 U.S. solar market total is not a reliability metric; outage duration and backup performance are site-specific.
Community solar subscription Sites with limited roof or land, or where on-site installation is impractical Eligible electricity accounts where local programs allow bill credits Subscription or other program-approved billing arrangement Accessing solar benefits without installing equipment on the business property Availability, credit calculation, cancellation terms, and savings depend on local program rules and utility billing. Community solar is included in broader solar-market activity but is not represented by the national 32.4 GWdc figure as a separate, directly comparable category.
Building-integrated photovoltaics (BIPV) New construction or major envelope renovations with suitable façades, roofs, or glazing Building loads where solar elements can be incorporated into the design Construction capital, project financing, or an integrated energy-service arrangement Combining building materials and electricity generation Coordinate early with the architect and engineer; assess output, code compliance, replacement, and maintenance access. The 2023 market-wide solar benchmark does not provide a standalone BIPV cost or deployment figure.
Solar carport plus EV charging Workplaces, campuses, or commercial sites with parking and vehicle-charging demand Daytime building loads plus charging that can be scheduled around solar production Purchase, loan, lease, PPA, or combined charging and energy-service financing Coordinating on-site generation with employee or fleet charging Charging demand, electrical service capacity, and charger utilization need to be assessed alongside solar output. The 2023 U.S. solar additions figure does not separately quantify solar-powered charging sites or their economics.
Off-site renewable electricity contract Businesses with limited on-site space and access to an eligible energy market Large, predictable consumption or portfolios with multiple facilities Power purchase agreement, green tariff, or other market-approved contract Matching electricity consumption with renewable generation beyond the property Check market eligibility, contract duration, settlement risk, renewable-attribute ownership, and accounting rules. The 2023 U.S. solar deployment benchmark reflects installed capacity; it does not establish the price or suitability of off-site contracts.

Benchmark note: In the United States, solar added 32.4 GWdc in 2023 and accounted for 53% of newly added electricity-generating capacity. The utility-scale solar LCOE range shown above is a 2023 benchmark, not a commercial rooftop quote or a retail electricity price. Project economics vary by location, tariff, system design, incentives, financing, and interconnection.

Planning Deployment: Assessing Costs, Grid Access, Permits, and Performance Metrics

Before selecting a solar system, compare the site’s hourly electricity use with its usable roof or land area. A clear south-facing roof may look ideal, but shade, structural limits, and daytime demand can change the economics. Ask an engineer to check roof loading and electrical capacity before requesting bids. Map the nearest grid connection and confirm export limits with the utility. Small details matter.

Separate equipment, installation, permitting, grid upgrades, and maintenance costs in each proposal. IRENA’s Renewable Power Generation Costs in 2023 reported a global weighted-average utility-scale solar cost of $0.044 per kilowatt-hour. That is a useful benchmark, not a commercial rooftop price quote. Model the project using local tariffs, financing terms, and expected self-consumption. Include contingency for switchgear or transformer upgrades; these are easy to underestimate.

Permit steps vary by location. Confirm building, electrical, fire-access, and utility requirements early, and allow time for reviews and interconnection studies. At year-end 2023, US grid queues held roughly 2,600 GW of proposed generation and storage, according to Berkeley Lab’s Queued Up 2024 report. Queue capacity is not a project-specific forecast, but it signals potential delays. Track monthly output, system availability, self-consumption, and avoided electricity costs against a documented baseline. Early yield estimates can be optimistic; weather and shading will test them.

Contact Us
close slider
Scroll To Top