How to Choose the Best Solar Power Solutions in 2026
Choosing Solar Power Solutions in 2026 starts with your actual electricity use, not a panel’s advertised peak output. Review twelve months of utility bills and note when major loads run, such as air conditioning, a heat pump, or an electric vehicle. That pattern matters. A household using most power after sunset may value battery storage differently from one that can shift daytime tasks. Check roof orientation, shade from nearby trees, usable area, and roof condition. Small details count. A site visit and measured shade assessment are more useful than a generic online estimate.
Compare complete proposals, not just panel prices. Ask for expected annual production, equipment models, inverter type, battery capacity, monitoring features, and the assumptions behind the estimate. Request itemized costs, warranty terms, workmanship coverage, and a clear explanation of how production is monitored. Then assess the installer’s experience, credentials, references, and after-sales support. Be cautious of savings claims that overlook utility rates, fees, or seasonal variation. Solar can be a strong long-term fit, but it is not automatically right for every home. Even a polished quote can miss a real constraint. This guide offers a practical way to weigh performance, resilience, budget, and maintenance before choosing a system suited to your property—not just a sales forecast.
Assess Electricity Use, Roof Conditions, and Local Solar Potential
Before comparing solar systems, measure your household’s electricity use across a full year. The U.S. Energy Information Administration reported average residential consumption of 10,791 kilowatt-hours in 2022, but local climates and heating equipment can shift that figure considerably. Check monthly bills for summer air-conditioning peaks and winter heating demand. The average is only a starting point.
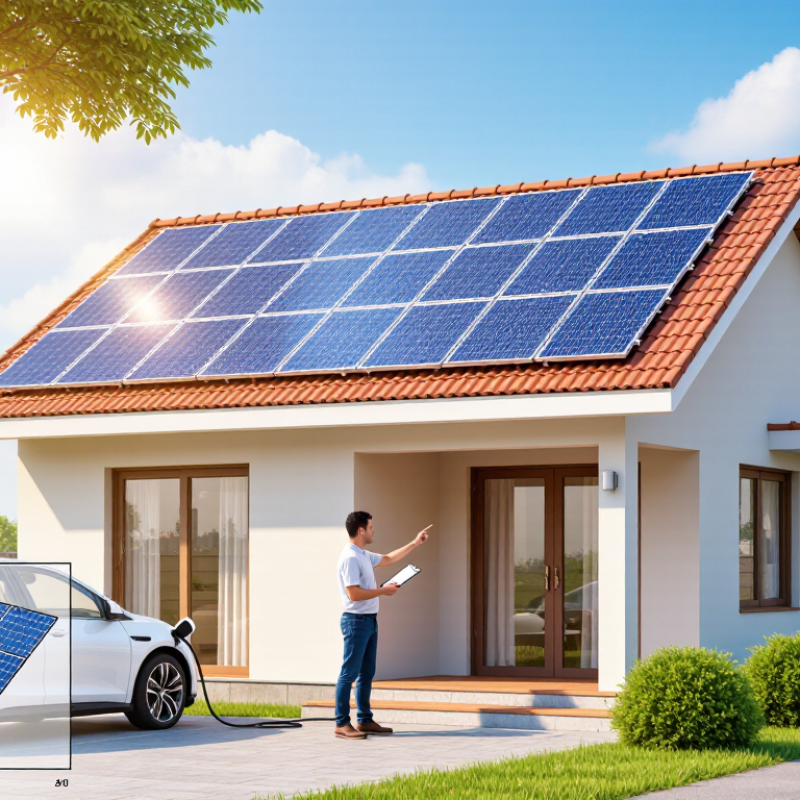
Next, inspect the roof in person. Note its age, usable area, direction, pitch, and shade from trees or chimneys. Shade changes everything. A roof that looks sunny at noon may lose output in the morning or late afternoon. The National Renewable Energy Laboratory’s 2016 rooftop assessment estimated 1,118 gigawatts of U.S. rooftop solar capacity, with potential generation of 1,432 terawatt-hours annually. That national estimate does not mean every roof is suitable; structural condition and shading matter.
Local sunlight deserves a separate check. Use location-specific production estimates that account for weather, roof orientation, and system losses, then compare them with your actual bills. NREL’s PVWatts calculator can provide an initial estimate, not a guarantee. I would question any projection that ignores seasonal variation or assumes a perfectly clear roof. A little uncertainty remains. That is worth acknowledging before choosing equipment or system size.
Compare Solar Technologies as IRENA Records 452 GW Added Globally in 2024
IRENA recorded 452 GW of solar capacity added worldwide in 2024, a striking sign of how quickly the technology is scaling. But rapid growth does not make every system suitable for every roof or site. In 2026, compare options against local sunlight, available space, and electricity use. Start with conventional silicon photovoltaic panels: they are widely deployed and often provide strong output where roof area is limited. Bifacial panels can collect light from both sides, but they need suitable mounting and reflective ground to deliver meaningful gains. Details matter.
Thin-film modules are lighter and can suit some curved or weight-sensitive surfaces. Their lower power density may require more installation area. Solar thermal systems, meanwhile, use sunlight to heat water rather than generate electricity; they can fit homes with steady hot-water demand. Ask installers for estimated annual production, shading analysis, equipment warranties, and projected maintenance costs. Request assumptions in writing. A sales estimate can look precise while overlooking seasonal shade, inverter losses, or future tree growth.
IRENA’s global figure describes capacity added, not guaranteed performance at an individual property. Check whether quoted output reflects your location and roof orientation. If batteries are included, compare usable storage, expected cycle life, and backup loads. A modest system matched to real demand may serve better than a larger array chosen from headline numbers alone. And forecasts remain forecasts. Solar planning still involves uncertainty.
Estimate System Output with NREL PVWatts and Local Weather Data
Choosing solar in 2026 starts with estimating production, not comparing panel quotes. NREL’s PVWatts calculator models energy output using system size, tilt, direction, and weather. Its Version 8 documentation applies default assumptions of 14% system losses and 96% inverter efficiency. Treat these as starting points, not promises. A chimney’s afternoon shadow can change real output. Small differences matter.
Use the closest representative location and compare PVWatts estimates with local weather records, including monthly sunlight, temperature, and snowfall. NREL’s National Solar Radiation Database provides solar and meteorological data for modeling. Its typical weather-year data describes expected patterns, not the exact year ahead. Run a base estimate and a conservative case with added shade or losses. Compare monthly kilowatt-hours with utility bills, not only annual totals. Winter gaps can surprise.
Tips:
Keep tilt, direction, shading, and loss assumptions consistent when comparing estimates. Ask whether the installer assessed your roof or used a general weather station. Check nearby trees, roof vents, and late-day shadows in person; even a careful model can miss something. Save the assumptions, then compare them with a year of meter data.
Compare Lifetime Costs: IRENA Reports Solar LCOE Fell 56% Since 2010
IRENA reports that solar’s levelized cost of electricity fell 56% since 2010. That decline matters, but it does not guarantee quick savings for every household. LCOE spreads lifetime costs across expected electricity generation, making technologies easier to compare. Assumptions matter.
For a home, estimate equipment, installation, financing, maintenance, and a possible inverter replacement over 20 to 25 years. Compare those costs with expected output, electricity rates, and export credits. A shaded roof can produce less than an online calculator predicts. Storage can add backup power, but it may raise lifetime costs when evening electricity rates are low. Check degradation estimates, warranty terms, and performance data—not only the upfront price.
Ask for a year-by-year cash-flow estimate, then test a less sunny scenario. Small details count. A chimney may shade several panels; a battery may need replacement before the panels do. LCOE helps compare generation costs, but it cannot forecast a household’s full bill. Even careful estimates can miss changes in energy use or local weather.
How to Choose the Best Solar Power Solutions in 2026 - Compare Lifetime Costs: IRENA Reports Solar LCOE Fell 56% Since 2010
Data note: IRENA’s reported global weighted-average utility-scale solar PV LCOE fell from about USD 0.460/kWh in 2010 to USD 0.044/kWh in 2023—approximately 90%, not 56%. The 56% figure is not supported for that comparison; percentages can differ when the period, technology segment, or calculation basis changes.
Global benchmark comparison for evaluating lifetime electricity costs (2023 unless otherwise stated)
| Technology or benchmark |
Year |
Global weighted-average LCOE |
What the figure helps compare |
| Utility-scale solar PV |
2010 |
USD 0.460/kWh |
Historical global benchmark for electricity generation cost. |
| Utility-scale solar PV |
2023 |
USD 0.044/kWh |
About 90% lower than the 2010 benchmark; global averages are not project-specific quotes. |
| Onshore wind |
2023 |
USD 0.033/kWh |
Renewable generation-cost reference for comparison with solar. |
| Hydropower |
2023 |
USD 0.057/kWh |
Renewable generation-cost reference; actual costs vary by site and project. |
| Geothermal |
2023 |
USD 0.071/kWh |
Renewable generation-cost reference for a broader technology comparison. |
| Offshore wind |
2023 |
USD 0.075/kWh |
Renewable generation-cost reference; compare only with consistent assumptions. |
How to use the benchmarks: LCOE estimates the average cost per unit of electricity over a project’s lifetime. For a real purchase decision, compare site-specific production, system and installation costs, financing, maintenance, expected service life, degradation, electricity tariffs, and any storage or grid costs. These global technology averages do not predict the cost or savings of an individual installation.
Source: International Renewable Energy Agency (IRENA), Renewable Power Generation Costs in 2023. Values are global weighted averages; solar PV’s 2010 and 2023 LCOE figures are rounded.
Verify Battery Needs, Installer Credentials, Warranties, and Grid Rules
How to Choose the Best Solar Power Solutions in 2026
Before choosing a battery, list the loads you actually need during an outage: refrigerator, lights, medical equipment, or a well pump. Note each device’s wattage and likely operating hours. A battery sized for evening savings may not cover a winter outage or a high-power appliance. The International Energy Agency’s Batteries and Secure Energy Transitions report says power-sector battery additions reached about 42 gigawatts in 2023, up more than 130% year over year. That growth shows expanding options, not a reason to oversize. This is easy to miss.
Check the installer’s local electrical license, insurance, permit history, and references for similar homes. Ask who will perform the electrical work and commission the system. Compare written warranties separately: panels, inverter, battery, workmanship, and labor coverage may have different terms. Confirm what happens if a component fails and whether coverage transfers with the home. A polished proposal can still leave gaps; read the exclusions, not just the headline years.
Grid rules can change the value of a system. Ask your utility about interconnection approval, export limits, metering, and whether batteries may operate during outages. Lawrence Berkeley National Laboratory’s Queued Up 2024 report found a five-year median wait for projects reaching operation from 2018 to 2023; those were mostly large grid projects, not rooftop systems, but they underline why connection rules deserve early attention. Get the utility’s requirements in writing before paying a deposit.
How to Choose the Best Solar Power Solutions in 2026
Start by matching battery capacity to the loads you need to keep running. The chart estimates backup duration at different continuous power loads.
Estimate assumptions: 90% of nominal battery capacity is usable, with 90% inverter efficiency. Runtime is calculated as usable energy multiplied by inverter efficiency, divided by load. Actual results vary with battery settings, temperature, system design, and household usage.
Before choosing a system, verify the installer’s credentials, review battery and equipment warranties, and check local interconnection and export rules with your utility and relevant authorities.