
Shopping cart

close
Tel : 94870 36000, 94860 36000, 94890 36000

What Is the Best Solar Plant in 2026?

What Is the Best Solar Plant in 2026? The answer depends on what “best” means. A utility-scale Solar Plant may deliver low-cost power to a large grid, while a smaller facility can serve local users more reliably. Nameplate capacity alone tells only part of the story. Location, sunlight, grid access, storage, operating costs, and environmental impacts all matter.

The International Energy Agency offers useful context. Its Executive Director, Fatih Birol, described solar as “the new king of electricity markets” in the IEA’s Renewables 2020 analysis. That phrase captures solar’s growing importance, but it does not identify one winning plant for every region. Real-world performance depends on weather, equipment quality, maintenance, and how well power can reach customers. A panel-covered site can look impressive from above. Its actual value is harder to judge.

This guide compares the factors that matter when evaluating leading solar projects in 2026, including output, cost, reliability, and storage. It also considers the trade-offs behind impressive figures. Rankings can mislead. A plant with exceptional annual production may still face transmission constraints or seasonal dips. Those details are easy to overlook, and I should not pretend that a single headline metric settles the question. The best Solar Plant is the one that performs well against clearly stated needs, with evidence that readers can check.
What Is the Best Solar Plant in 2026?

Defining What “Best” Means for a Solar Plant in 2026

What Is the Best Solar Plant in 2026?

Defining What “Best” Means for a Solar Plant in 2026

“Best” is not a single ranking. It depends on what a plant must deliver, where it operates, and who relies on its power. A useful assessment considers dependable output, operating costs, land and water needs, and expected service life. It should also account for how well production matches local demand. A plant with impressive peak capacity may contribute less during cloudy afternoons or periods of grid congestion.

Real-world performance matters more than a sunny-day estimate. Compare measured energy production with forecasts across seasons, and check how often equipment is unavailable. Consider maintenance access, panel cleaning needs, and the distance to a suitable grid connection. These details can change a project’s value. So can local conditions: dusty sites, limited water, or steep terrain may require different designs. “Best” is contextual. I would not treat any one metric as decisive; even a careful comparison leaves some uncertainty.

Tips: Ask for multi-year production data, not just projected output. Check how estimates handle cloudy weather, equipment downtime, and grid limits. Compare costs over the full operating life, and confirm who is responsible for maintenance. A clear answer should explain its assumptions, not hide them.

How Solar Plants Generate and Deliver Electricity

What Is the Best Solar Plant in 2026?
How Solar Plants Generate and Deliver Electricity

A solar plant begins with sunlight striking photovoltaic cells. These cells produce direct-current electricity, or DC. Inverters convert it into alternating current, or AC, which can travel through power lines and serve homes and businesses. Transformers raise the voltage before electricity enters the grid. Plant operators monitor output, equipment temperature, and faults. The process looks simple from a distance. Up close, it depends on many coordinated parts.

Tips: Check the inverter and transformer ratings, not just the panel count. Ask how the plant tracks outages and changing output. Clouds matter.

Once electricity reaches the grid, its path depends on local demand and network conditions. It may travel through transmission lines to a distant town, then pass through substations before reaching neighborhood wires. Batteries can store some daytime energy for later use, but storage adds cost and does not remove every supply gap. Small losses add up along the way.

There is no single “best” solar plant for every place in 2026. Strong sunlight helps, but grid access, maintenance, land conditions, and storage needs also matter. A plant can produce impressive midday power yet deliver less during cloudy periods or evening peaks. That trade-off is easy to overlook, and honestly, rated capacity alone tells only part of the story.

What Is the Best Solar Plant in 2026? How Solar Plants Generate and Deliver Electricity

Typical clear-sky output profile for a modeled 100 MW utility-scale solar plant. Values are illustrative, not measured data.

Solar panels convert sunlight into direct current (DC). Inverters convert DC into alternating current (AC), which transformers raise to grid voltage. Output rises and falls with sunlight, while equipment and transmission losses mean delivered electricity can be lower than panel output.

Key Criteria for Comparing Solar Plant Performance

A solar plant’s performance is not captured by panel efficiency alone. Compare annual energy delivered per installed kilowatt, adjusted for local sunlight, heat, dust, and shading. Then examine availability: how often inverters and other equipment keep the plant operating. Small interruptions matter. A plant can look excellent on paper yet lose output during repeated equipment faults. NREL’s widely cited review of photovoltaic field studies found median module degradation near 0.5% per year. Check whether a project’s measured decline matches that benchmark, while accounting for differences in climate and measurement periods.

Cost per kilowatt-hour adds another useful comparison. IRENA’s Renewable Power Generation Costs in 2023 reported a global weighted-average levelized cost of electricity of $0.044 per kilowatt-hour for newly commissioned utility-scale solar PV. That figure is a reference, not a promise: financing, grid connection, land, and storage needs vary by site. Compare estimates using the same assumptions and lifetime. Also check curtailment, water use, and end-of-life plans. Weather matters. A desert site may produce abundant midday power but face dust and transmission limits. The strongest plant is often the one delivering reliable, useful electricity at a competitive total cost. Still, no single score captures every trade-off.

What Is the Best Solar Plant in 2026? — Key Criteria for Comparing Solar Plant Performance

There is no single best solar plant for every location. Compare projects using consistent operating data, site conditions, grid requirements, and lifecycle costs.

Performance criterion Useful reference range or measure What strong performance looks like How to compare projects fairly
Annual energy yield Measured in MWh per MW of installed capacity per year; the value depends heavily on local sunlight and system design. High, independently modelled annual generation that is supported by site-specific solar-resource and weather data. Compare generation on the same capacity basis and for the same location, weather period, and loss assumptions.
Capacity factor Utility-scale solar PV commonly falls around 15–35%, depending on location, tracking, and plant design. A value near the upper end of the range for the same solar resource and technology, without unrealistic production assumptions. Separate fixed-tilt and tracking projects, and check whether the figure is based on AC or DC capacity.
Performance ratio Approximately 75–90% is a commonly used indicative range for operating PV systems. Consistent results near the upper part of the range after accounting for temperature, inverter, wiring, and other system losses. Use the same calculation method and reporting period; review the effects of weather, curtailment, and unavailable equipment.
Plant availability Operational targets are often above 98%, but definitions and exclusions vary by contract. High equipment availability, with maintenance planned to limit outages during high-generation periods. Check whether scheduled maintenance, grid outages, and force-majeure events are included or excluded.
Annual degradation Modern PV module degradation is often estimated at roughly 0.3–0.8% per year; actual rates vary. Low measured degradation supported by long-term performance records and appropriate equipment warranties. Distinguish module degradation from total plant output changes caused by soiling, equipment failures, or changing weather.
DC-to-AC capacity ratio A DC-to-AC ratio of about 1.1–1.4 is common in utility-scale PV design. A ratio selected to improve annual energy production and project economics without excessive clipping. Compare the ratio alongside inverter sizing, expected clipping, interconnection limits, and hourly generation profiles.
Land requirement About 5–10 acres per MW of DC capacity is a broad U.S. utility-scale PV reference range. Efficient land use that still allows for setbacks, access roads, drainage, vegetation management, and safe maintenance. Confirm whether the stated area covers the solar array only or the full project boundary; terrain and site rules affect land use.
Lifecycle greenhouse-gas emissions Solar PV lifecycle estimates are commonly in the tens of grams of CO₂-equivalent per kWh; roughly 20–50 g CO₂e/kWh is an indicative range. Low lifecycle emissions, assessed across manufacturing, construction, operation, and end-of-life stages. Use the same lifecycle boundary, electricity-yield assumptions, and emissions methodology for every project.
Levelized cost of energy (LCOE) No universal benchmark: LCOE depends on capital cost, financing, location, operating costs, lifetime, and output. Competitive lifetime cost supported by transparent assumptions and realistic generation forecasts. Compare projects using the same currency, price year, discount rate, project life, tax treatment, and storage assumptions.
Grid integration and flexibility Assess interconnection capacity, curtailment risk, ramping requirements, and any planned storage or grid-support functions. Reliable delivery that matches grid requirements, with clearly documented operating limits and any storage strategy. Review grid studies and hourly production data; do not treat battery storage as included unless its capacity and costs are specified.

Interpretation: These figures are broad reference ranges, not guarantees or rankings. The best-performing project is the one that delivers reliable, cost-effective energy under the local solar resource, grid conditions, and environmental requirements.

Major Solar Plant Types and Their Uses

What Is the Best Solar Plant in 2026? Major Solar Plant Types and Their Uses

The best solar plant depends on where power is needed, available land, and how steadily electricity must be delivered. Utility-scale photovoltaic plants suit open, sunny sites and feed electricity into the grid. Rooftop systems generate power close to homes, factories, or warehouses, often reducing daytime grid demand.

IRENA’s Renewable Capacity Statistics 2025 reports that global solar capacity reached about 1,865 GW in 2024. That scale reflects many different applications, not one universal design.

Concentrated solar power, or CSP, uses mirrors to focus sunlight and produce heat. Some plants store that heat, allowing generation after sunset. This can help when evening power is valuable, though CSP needs strong direct sunlight and substantial land.

IRENA’s Renewable Power Generation Costs in 2023 report put average utility-scale solar PV costs at about $0.044 per kilowatt-hour, compared with $0.117 for CSP.

These are global averages, not quotes for a particular project. Site conditions can change the calculation.

Floating solar panels can use reservoirs where suitable land is scarce. Agrivoltaic projects place panels above or beside crops, sharing land between energy and farming. Results depend on crop type, panel height, water access, and local climate. The trade-offs are real. A design that helps one farm may complicate another’s harvest, and evidence from individual projects should not be treated as a guarantee.

How Location Shapes the Best Solar Plant Choice

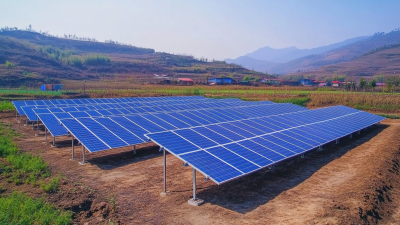
In 2026, the best solar plant is not defined by one panel type or layout. It is the system that fits its location. A sunny desert may offer strong annual output, yet dust, limited water, and a distant grid connection can reduce its practical value. Coastal sites face salt corrosion and storm exposure. Rooftops and uneven land bring different limits. Small details matter.

A sound choice starts with local measurements, not a map’s color. Developers compare sunlight by hour, seasonal cloud cover, shading, soil strength, slope, and road access. They also assess how far electricity must travel to reach a suitable connection point. A cooler, less sunny site near existing infrastructure can sometimes make more financial sense than a hotter, remote one. That trade-off deserves careful modeling. Estimates should account for heat, soiling, wiring losses, and downtime. No forecast is perfect.

Tips: Visit the site after rain and during the hottest season. Look for standing water, dust, and nearby tree growth. Ask for measured shading and grid-connection estimates, not just an annual production figure. Leave clear paths for maintenance. Easy to overlook.

Contact Us
close slider
Scroll To Top